Tour Imply Lumi
This topic helps you learn to navigate and use the Imply Lumi UI based upon the navigation menu. The navigation menu is available from any page in the Lumi UI. When you don't need the navigation menu, you can collapse it to maximize usable screen real estate.
Explore
The Explore view is the default view when you log in to Imply Lumi.
From anywhere in the UI, you can click Explore to access the Explore view. Search events using a combination of expressions in the search bar, the time range selector, and the attributes panel.

The elements on the Explore events page are as follows:
- Search bar: Enter search criteria to find events.
- Events bar chart: Shows the number of events created during the selected time range.
- Time range selector: Range of time to limit search results.
- Attributes panel: List of user attributes in events.
- Events list: List of events that match the search criteria.
See Search for events with Imply Lumi for more information.
To manage the display of columns in the events list, click a column heading to display the following options:
- Add column to the left/right.
- Move left/right.
- Remove this column.
You can't remove the Time and Content columns. Time is always on the far left and Content is always on the far right, so the options available for these columns are limited.
Event details pane
Click a specific event in the events list to access the event details.

The event details pane provides a comprehensive view of individual events and help you understand where the data comes from, how it is processed, and its context in the system.
The event details pane are as follows:
- Search bar: Allows you to quickly filter attributes by name or value.
- Message section: Shows the raw event message.
- User attributes: Displays custom data fields that are part of an event. See User attributes for more information.
- System attributes: Lists metadata added by Imply Lumi. See System attributes for more information.
Pipelines
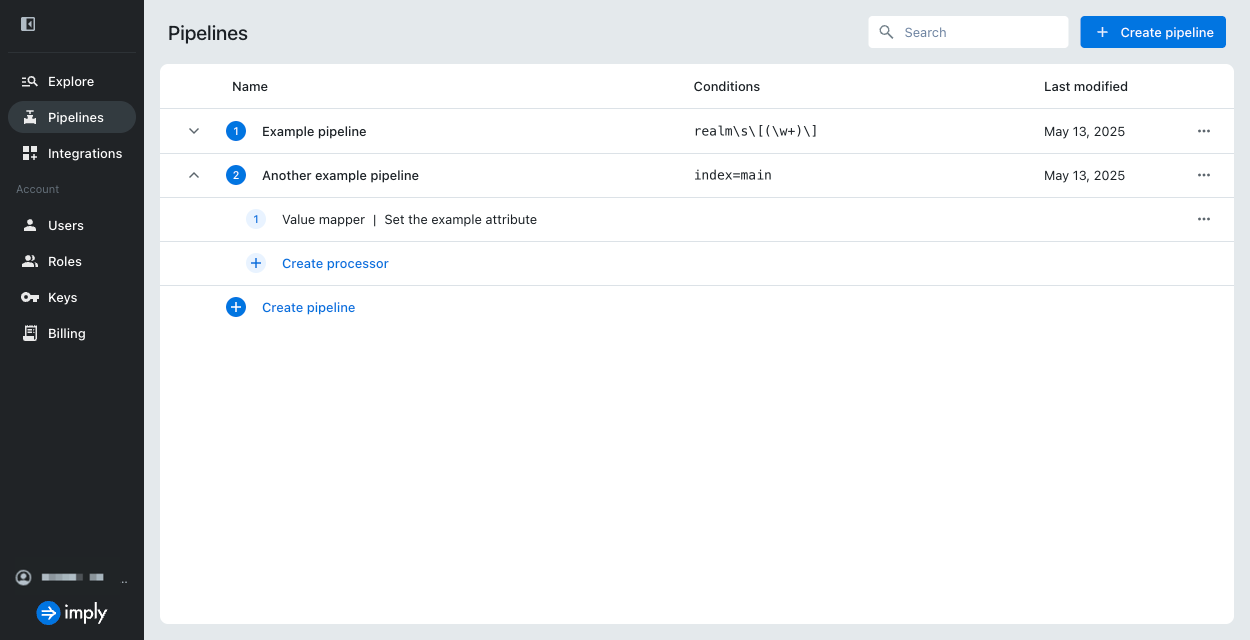
Click Pipelines in the navigation menu to view a list of your pipelines and processors in order of execution.
Pipelines are ordered rules for event transformation. Pipelines are ordered lists of event processors that operate on a search query that you define.
On the Pipelines page you can:
- Create new pipelines and processors.
- Reorder existing pipelines and processors.
- Enable and disable pipelines and processors.
See Transform events with pipelines for more information.
Integrations
Click Integrations in the navigation menu to view and manage your integrations. Each tile represents an integration type, categorized by sending and querying events. For information on sending events, see Send events to Imply Lumi.
Use the federated search feature to issue queries on Imply Lumi events in Splunk® software. See Set up federated search for more information.
Integrations that have added or searched events in the past 24 hours display an Active icon in the top section of the tile.

Click the tile for the integration for which you want to configure or view IAM keys. To create a new integration, click + View instructions and proceed to the integration details.
The integration's keys page displays a list of IAM keys that have been used for that integration at any point in time. Keys that haven’t been used to add or search events aren't shown. For example, if you create a key through the HEC integration but don't use it to add events, the key won't appear under HEC integrations.
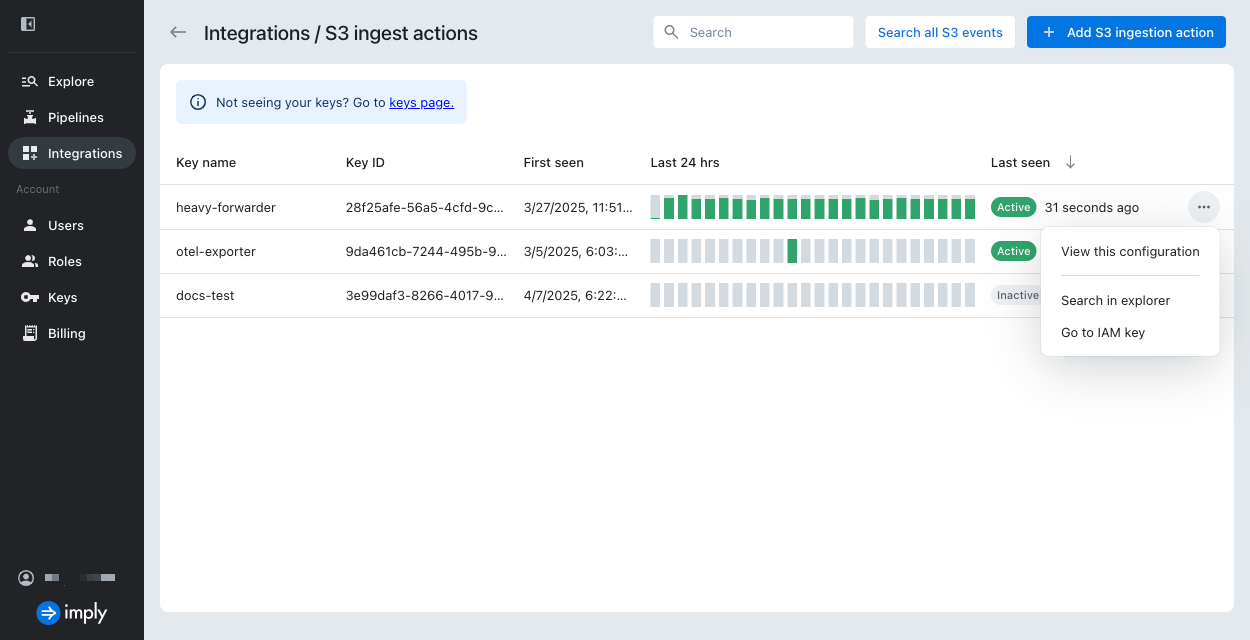
For more information about the integration IAM keys page, see View IAM keys for an integration.
Users
Click Users in the navigation menu to create users and assign roles. You can also invite users to Imply Lumi.
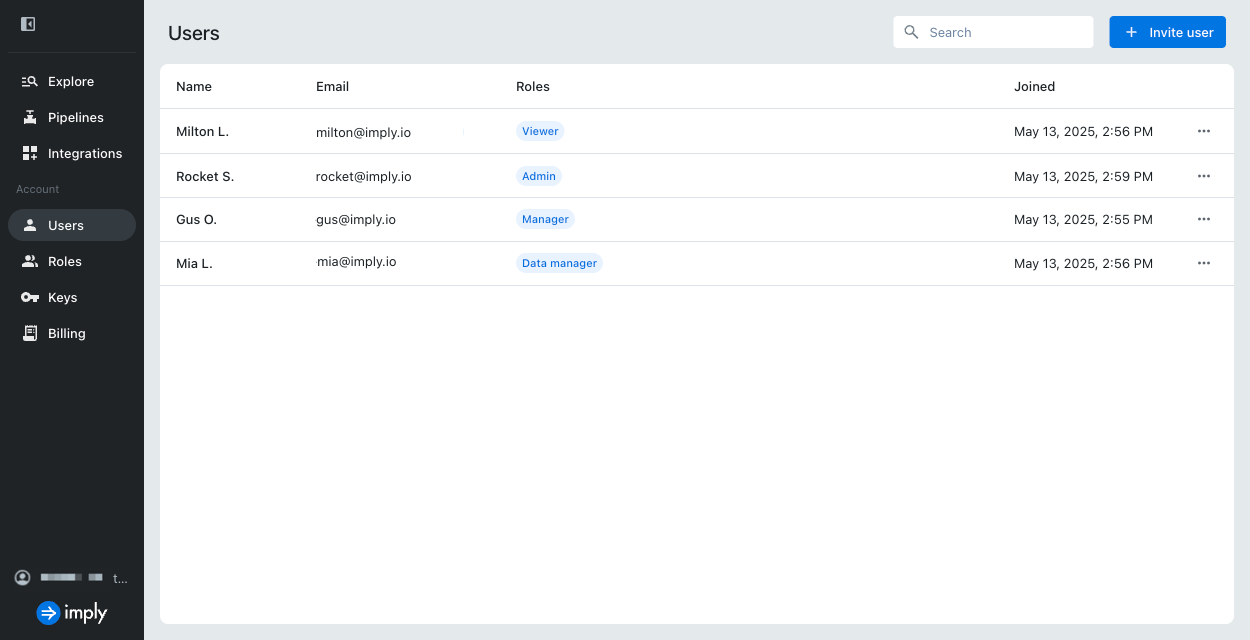
Click a user to display more information, including the permissions granted for the user's role.
See Manage users for details.
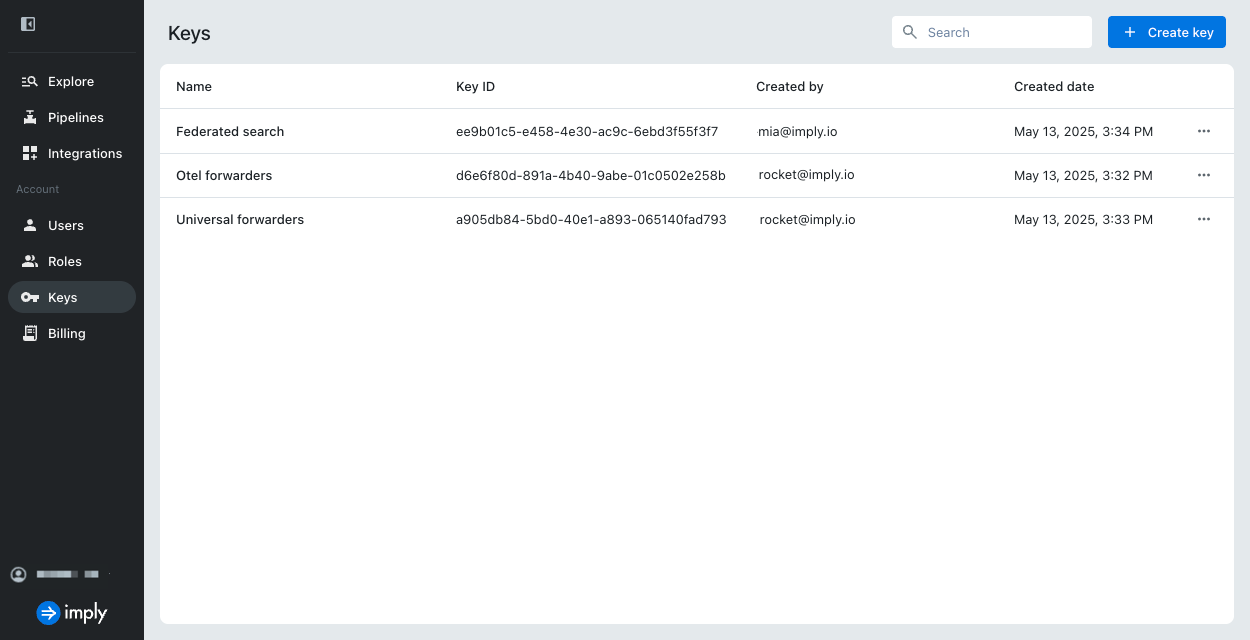
Keys
Click Keys in the navigation menu to create IAM keys. You use IAM keys to send events to Imply Lumi and to configure federated search from Splunk. See Manage IAM keys for details.
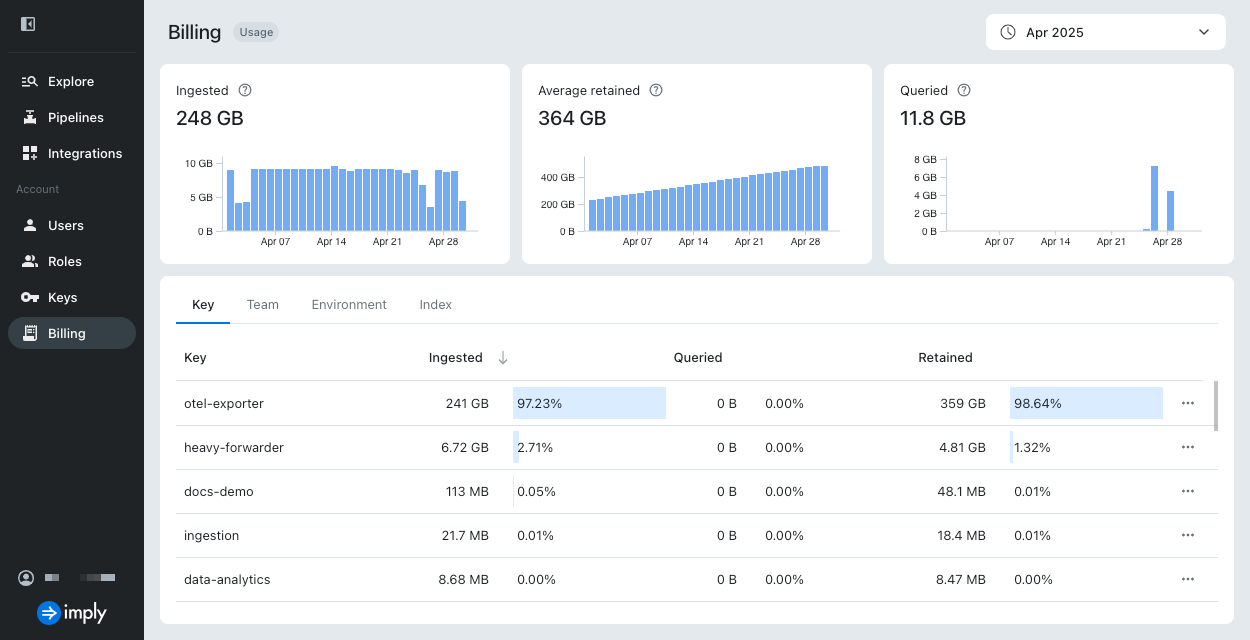
Billing
Click Billing in the navigation menu to monitor account usage. You can view interactive graphs that display account usage for each metered component as well as a monthly breakdown of usage by attributes. See Monitor account usage for details.