Monitor account usage
Imply Lumi meters the resources you consume to ingest, query, and retain events each month. The Usage sub-page of the Billing section shows how these metrics change over time. It includes interactive bar charts that display account usage for each metered component as well as a monthly breakdown of usage by attribute. To access the Billing section, you need the Admin role. For more information on roles, see Manage roles.
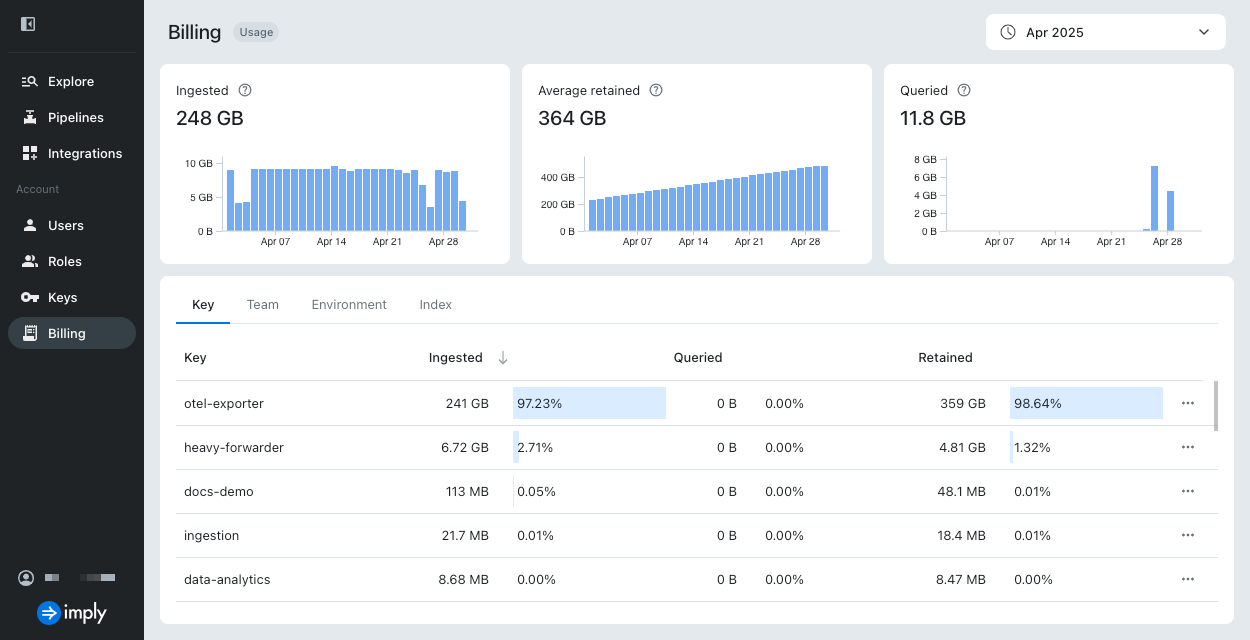
A bar in each bar chart represents a single day. Hover over a bar to view the amount of data, in bytes, processed on that day. Click a bar, then select Zoom In to view detailed usage. You can click the bar again to zoom in further to the hourly level.
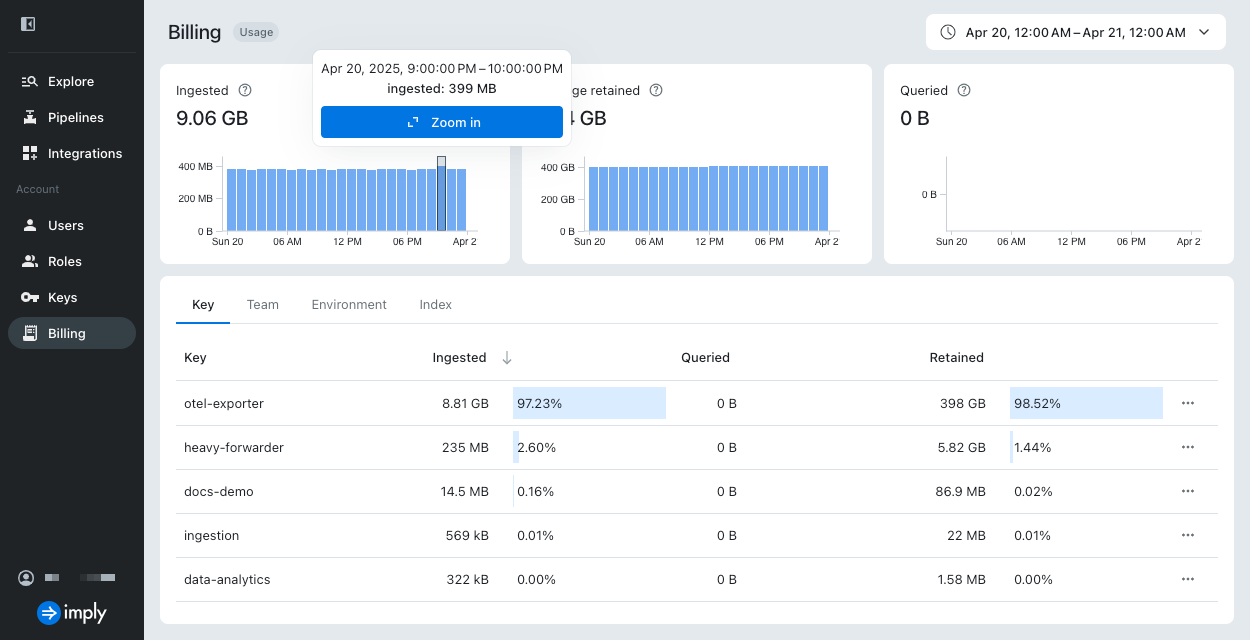
To select multiple bars, click and drag your pointer across the bars.
Usage metrics
Click Billing in the navigation menu to access usage metrics. Use the calendar dropdown or date selector to view usage information for a specific month or custom date range.
Imply Lumi meters resource usage across the following metrics:
- Ingested: Cumulative amount of data ingested into Imply Lumi during the selected time period.
- Average retained: Average amount of data retained in Imply Lumi during the selected time period.
- Queried: Cumulative amount of data processed by Imply Lumi in response to queries during the selected time period.
View usage by attribute
Imply Lumi provides a monthly breakdown of usage, grouped by an attribute such as key, team, environment, or index. For information about event attributes, see Event model. To view usage details for a specific attribute, click the corresponding tab. By default, the current usage for a metric is sorted in descending order.
To view the underlying query in the Explore view, click the ellipsis next to the attribute and select Explore events.
Learn more
See the following topics for more information:
- Event model for Imply Lumi event components.
- Event lifecycle for an overview of how events are processed.