Search Imply Lumi events with Splunk
Once you set up federated search, you can search an index in Imply Lumi using a federated index in Splunk®.
With federated search, you use Splunk Search Processing Language (SPL) to query Imply Lumi events.
This topic provides federated search examples using SPL commands, functions, and expressions that Imply Lumi supports.
Supported commands
Some SPL commands in federated search run on the federated search head (Splunk) and others run on the remote search head (Imply Lumi). This topic lists commands that run on the federated search head by design and commands Imply has implemented on the remote search head.
If you want to use an SPL command that isn't listed here, try it out - it might work. If it doesn't, contact your Imply representative. We're adding more commands to the remote search head and we can prioritize the commands you need.
See the documentation on Splunk command types for information on how and where the search head processes commands.
Examples
You can run the example federated search queries below against the example data for tutorials.
Imply Lumi supports all Splunk search modes for federated search. See the Splunk documentation for more information.
search
The search keyword is implied at the beginning of a query. Supported operators for filters and wildcards are as follows:
| Operator | Use | Example |
|---|---|---|
= | Equal to | status=200 |
!= | Not equal to | status!=200 |
> | Greater than | count>400 |
>= | Greater than or equal to | total_events>=5000 |
< | Less than | host_event_count<100 |
<= | Less than or equal to | percent<=50 |
"" | Phrase | "Intel Mac" |
* | Wildcard | uri="*policy*" |
CASE | Make case-sensitive | CASE(Intel) |
NOT | Exclude matching events | NOT "/orders" |
OR | Match two or more conditions | status=500 OR level=error |
appendcols
Count the total number of events and append the count of successful requests as an additional column in the same row:
index="federated:lumi_main"
| stats count as total_events
| appendcols [
    search index="federated:lumi_main" status=200
    | stats count as successful_requests
  ]
Example output:
| total_events | successful_requests |
|--------------|---------------------|
| 214352       | 148242              |
For more information, see the Splunk documentation on appendcols.
appendpipe
Show the count of status=200 events per host and append a row with the total count across all hosts:
index="federated:lumi_main"
| stats count as host_event_count by host
| appendpipe [
    stats sum(host_event_count) as total_events
  ]
Example output:
| host     | host_event_count | total_events |
|----------|------------------|--------------|
| 10.0.1.5 | 1683             |              |
| 10.0.1.6 | 1654             |              |
| 10.0.1.7 | 1677             |              |
|          |                  | 5014         |
For more information, see the Splunk documentation on appendpipe.
concurrency
Retrieve 100 recent events, assume each event spans 5 minutes, and calculate how many of those events overlap at any point in time.
index="federated:lumi_main"
| head 100
| eval start=_time, duration=300
| concurrency start=start duration=duration
For more information, see the Splunk documentation on concurrency.
datamodel
Assuming the sample data is mapped to the Web data model, use the Web object to filter events where the URI is /track-order. Count the number of events by status and URI:
index="federated:lumi_main"
| datamodel Web Web search
| search uri="/track-order"
| stats count by status, uri
For more information, see the Splunk documentation on datamodel.
eval
Check if the useragent exactly matches Google's bot identifier and count how many events are from bots versus non-bots:
index="federated:lumi_main"
| eval is_bot=if(useragent="Mozilla/5.0 (compatible; Googlebot/2.1; +http://www.google.com/bot.html)", "yes", "no")
| stats count by is_bot
Example output:
| is_bot | count |
|--------|-------|
| no     | 254   |
| yes    | 54    |
For more information, see the Splunk documentation on eval.
eventstats
Add a field to every event showing how many events its user has in the entire result set:
index="federated:lumi_main"
| eventstats count as user_event_count by user
For more information, see the Splunk documentation on eventstats.
fields
Find all HTTP 400 (Bad Request) events, displaying only the host, source, and method fields in the results:
index="federated:lumi_main" status=400 | fields host, source, method
For more information, see the Splunk documentation on fields.
fieldsummary
Summarize the status field:
index="federated:lumi_main" | fields status | fieldsummary
For more information, see the Splunk documentation on fieldsummary.
head
Search for events where method is either GET or POST, and show the five most recent results:
index="federated:lumi_main" method IN (GET, POST) | head 5
For more information, see the Splunk documentation on head.
map
Find the top two hosts with the most HTTP 403 (Forbidden) errors, then for each host, search all events to show how many times each uri was accessed.
index="federated:lumi_main" status=403
| stats count by host
| head 2
| map search="search index=federated:lumi_main host=$host$
| stats count by uri"
Example output:
| uri           | count |
|---------------|-------|
| /account      | 876   |
| /best-sellers | 861   |
| /brands       | 910   |
For more information, see the Splunk documentation on map.
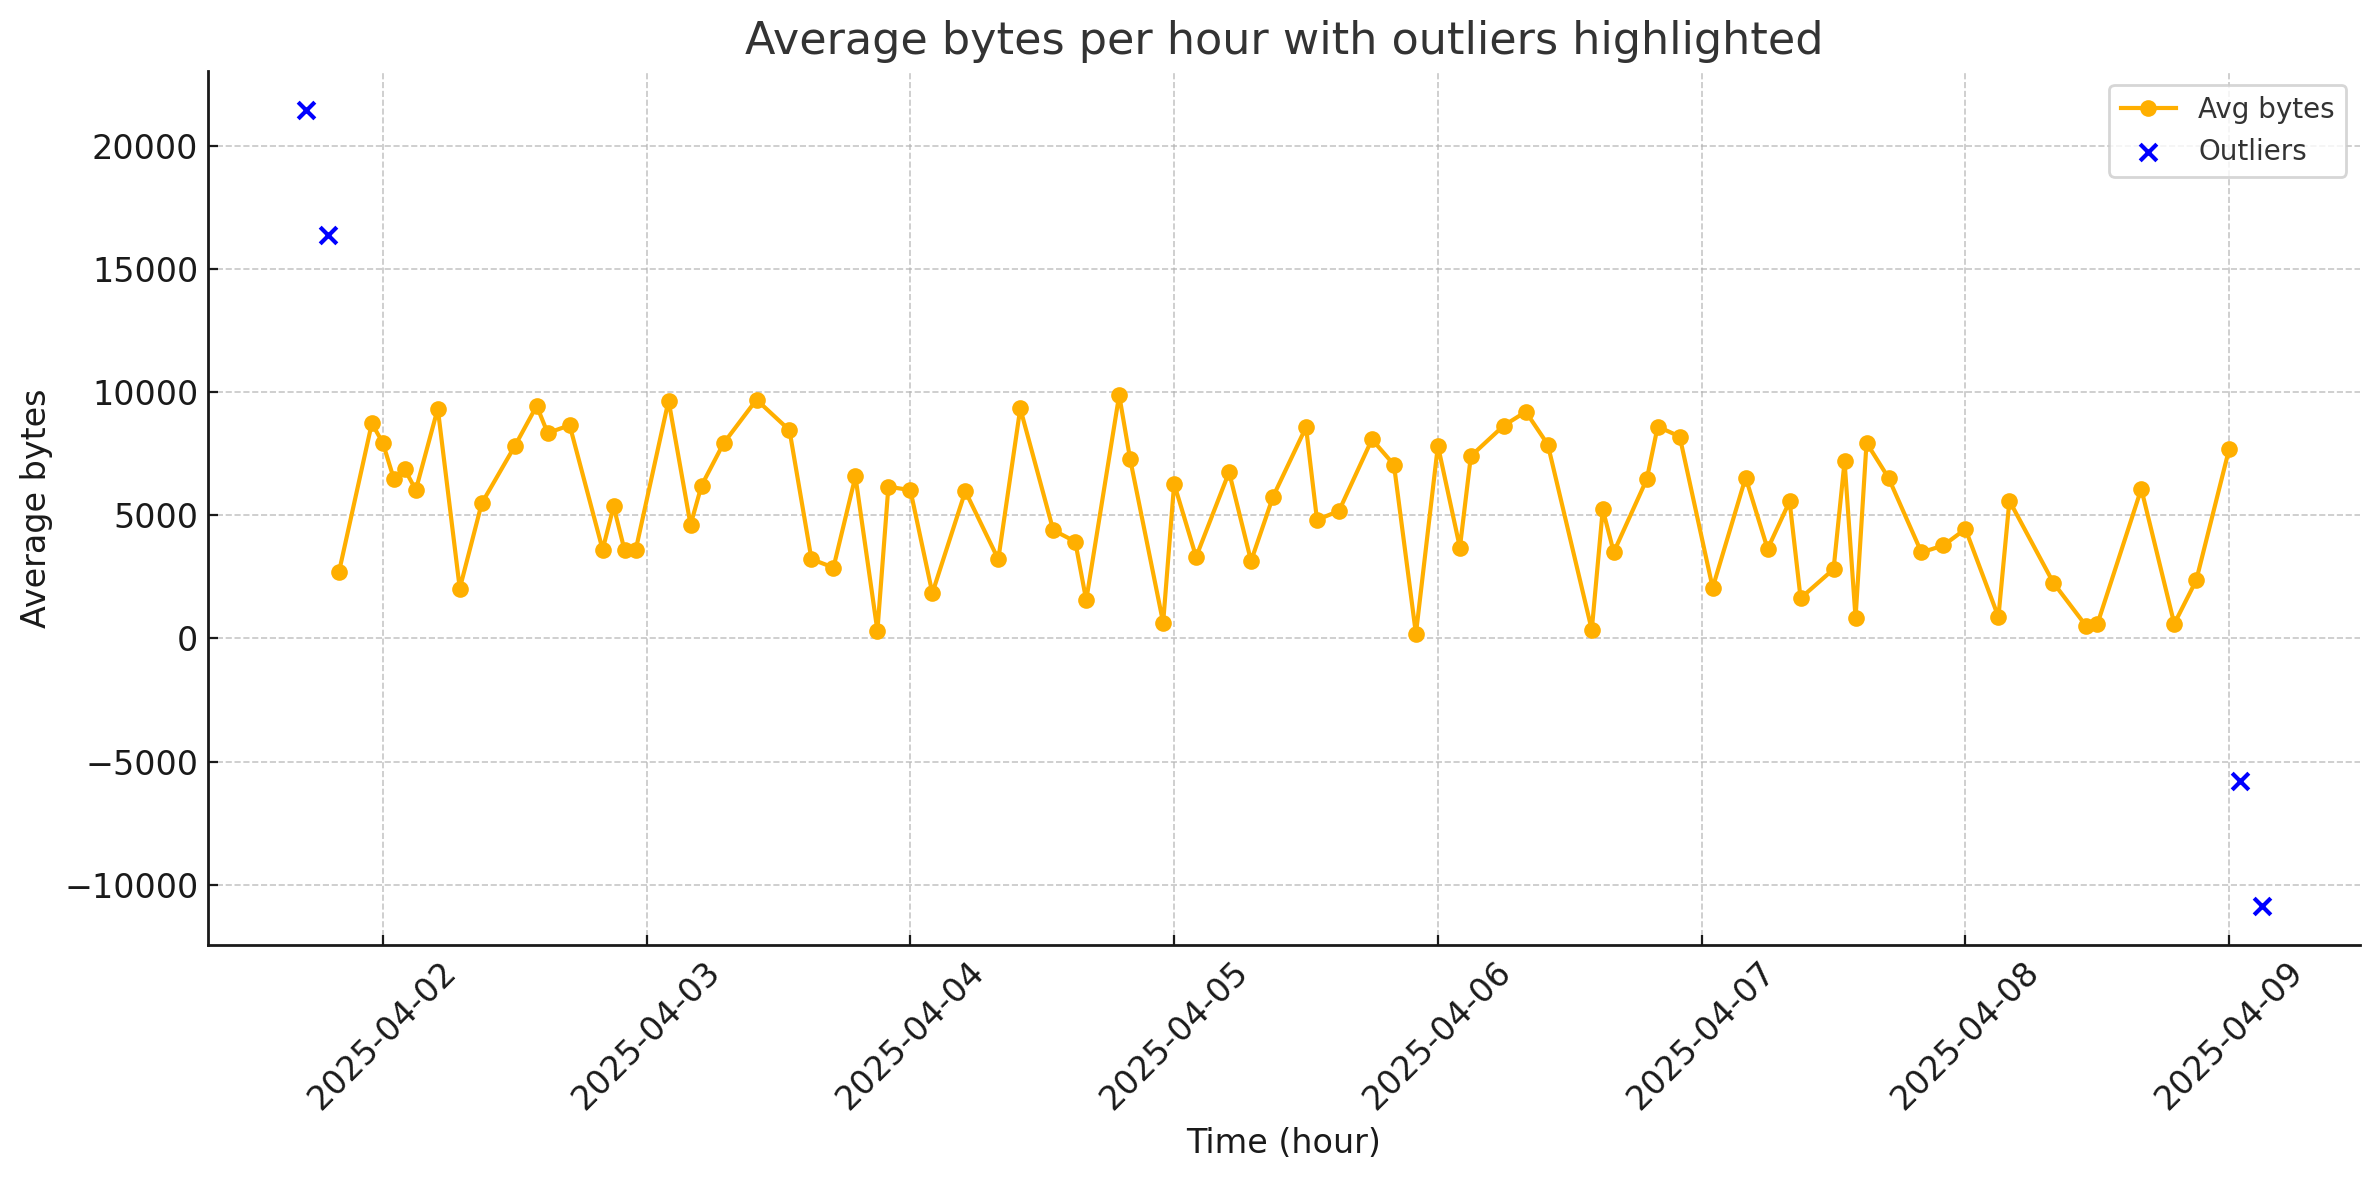
outlier
Aggregate average bytes transferred per hour and flag statistical outliers in the average byte values in a timechart.
index="federated:lumi_main"
| timechart span=1h avg(bytes) as avg_bytes
| outlier avg_bytes
Example output. Note that fabricated data was added to the sample data to display outliers:
For more information, see the Splunk documentation on outlier.
rename
Note that Imply Lumi doesn't support renaming similarly named fields using wildcards.
Count events by status code and rename the status field to http_status for clearer labeling in the output:
index="federated:lumi_main"
| stats count by status
| rename status AS http_status
For more information, see the Splunk documentation on rename.
reverse
Select the first five events and reverse their order, so the most recent event appears last in the output.
index="federated:lumi_main"
| head 5 | reverse
For more information, see the Splunk documentation on reverse.
setfields
Set the host, status, and uri fields to specific values and display the results in a table:
index="federated:lumi_main"
| setfields host="10.0.1.19", status="200", uri="/shipping-policy"
| table host, status, uri, _time
For more information, see the Splunk documentation on setfields.
sort
Note that you can't sort on calculated fields.
Retrieve all HTTP 400 (Bad Request) events, show the host, source, and method fields only, and sort the results alphabetically by host:
index="federated:lumi_main"
| status=400
| fields host, source, method
| sort host
For more information, see the Splunk documentation on sort.
stats
Count the total number of successful requests and the number of unique client IPs:
index="federated:lumi_main" status=200
| stats count AS total_requests, dc(clientip) AS unique_ips
Example output:
| total_requests | unique_ips |
|----------------|------------|
| 171            | 145        |
Note that Imply Lumi doesn't support the use of optional arguments with stats.
For more information, see the Splunk documentation on stats.
tail
Search for all HTTP 400 (Bad Request) events, returning only the last three matching events:
index="federated:lumi_main" status=400 | tail 3
For more information, see the Splunk documentation on tail.
top
Show the most common URIs accessed in the index, with how often they appear and their percentage of total events:
index="federated:lumi_main" | top uri
Example output:
| uri              | count  | percent |
|------------------|--------|---------|
| /home            | 524    | 23.4%   |
| /shipping-policy | 312    | 13.9%   |
| /contact         | 290    | 12.9%   |
For more information, see the Splunk documentation on top.
tstats
Assuming the sample data is mapped to the Web data model, count the number of events per host using the Web object:
tstats count AS host_event_count BY host
FROM datamodel=Web.Web
WHERE index="federated:lumi_main"
Example output:
| host   | host_event_count |
|--------|------------------|
| web-01 | 854              |
Note that Imply Lumi doesn't support the use of optional arguments with tstats.
For more information, see the Splunk documentation on tstats.
where
Retrieve events where the host is 10.0.1.19 and the status is 200:
index="federated:lumi_main"
| WHERE host = "10.0.1.19" AND status = 200
For more information, see the Splunk documentation on where.
Supported functions and expressions
The following SPL commands supported in Imply Lumi use evaluation functions:
evalfieldformatheadwhere
Imply Lumi supports the following comparison and conditional functions:
ifcasecidrmatchcoalescefalseifmatch
Imply Lumi supports Java regex matching, not Perl regex matching.nullnulliftruevalidate
Evaluation functions use operators to generate results. Imply Lumi supports the following operators:
- Mathematical:
+,-,*,/,%. - Comparison:
=,==,!=,>,>=,<,<=. - Unary minus:
-. - Period for concatentation:
..
Imply Lumi supports the following mathematical functions:
absceiling/ceilexpfloorlnpipowroundsqrt
Imply Lumi supports the following text functions:
lenlowerltrimrtrimtrimupperurldecode
See the Splunk documentation on evaluation functions, mathematical functions, text functions, types of expressions, and field expressions for information on the functions and expressions Splunk supports.
Examples
You can run the example federated search queries below against the example data for tutorials.
Create a new field is_success that equals 1 when status is 200 and 0 otherwise, and show a table with _time, user, status, and is_success.
index=index="federated:lumi_main"
| eval is_success = status == 200
| table _time, user, status, is_success
Example output:
| _time               | user       | status | is_success |
|---------------------|------------|--------|------------|
| 2025-05-13 14:38:52 | aaron94    | 400    | 0          |
| 2025-05-13 14:38:29 | michelle00 | 301    | 0          |
| 2025-05-13 14:38:18 | ochambers  | 200    | 1          |
Concatenate uri and user with a colon, add to a new field uri_user, and show a table with _time, uri, user, and uri_user.
index=index="federated:lumi_main"
| eval uri_user = uri . ":" . user
| table _time, uri, user, uri_user
Example output:
| _time               | uri      | user     | uri_user        |
|---------------------|----------|----------|-----------------|
| 2025-05-13 11:22:21 | /logout  | aaron94  | /logout:aaron94 |
| 2025-05-13 11:22:19 | /account | eric52   | /account:eric52 |
| 2025-05-13 11:22:15 | /shop    | rhawkins | /shop:rhawkins  |
Learn more
See the following topics for more information:
- Set up federated search for details on configuring federated search of Imply Lumi events within Splunk.
- Monitor federated search performance for information on examining aspects of a search.
- Search for events with Imply Lumi for search methods and syntax.