Monitor federated search performance
When you use federated search to query Imply Lumi events in Splunk®, you can use the Splunk job inspector to examine aspects of the search. The job inspector includes components specific to Imply Lumi to help you troubleshoot federated queries of Imply Lumi events.
Access the Splunk job inspector
To access the job inspector:
-
In Splunk Cloud or Splunk Enterprise, perform a search against an Imply Lumi federated index. See Search Imply Lumi events with Splunk for supported commands and query examples.
-
Below the search bar, click Job and select Inspect job. You can select the job inspector while the search is still running, or when it's complete.
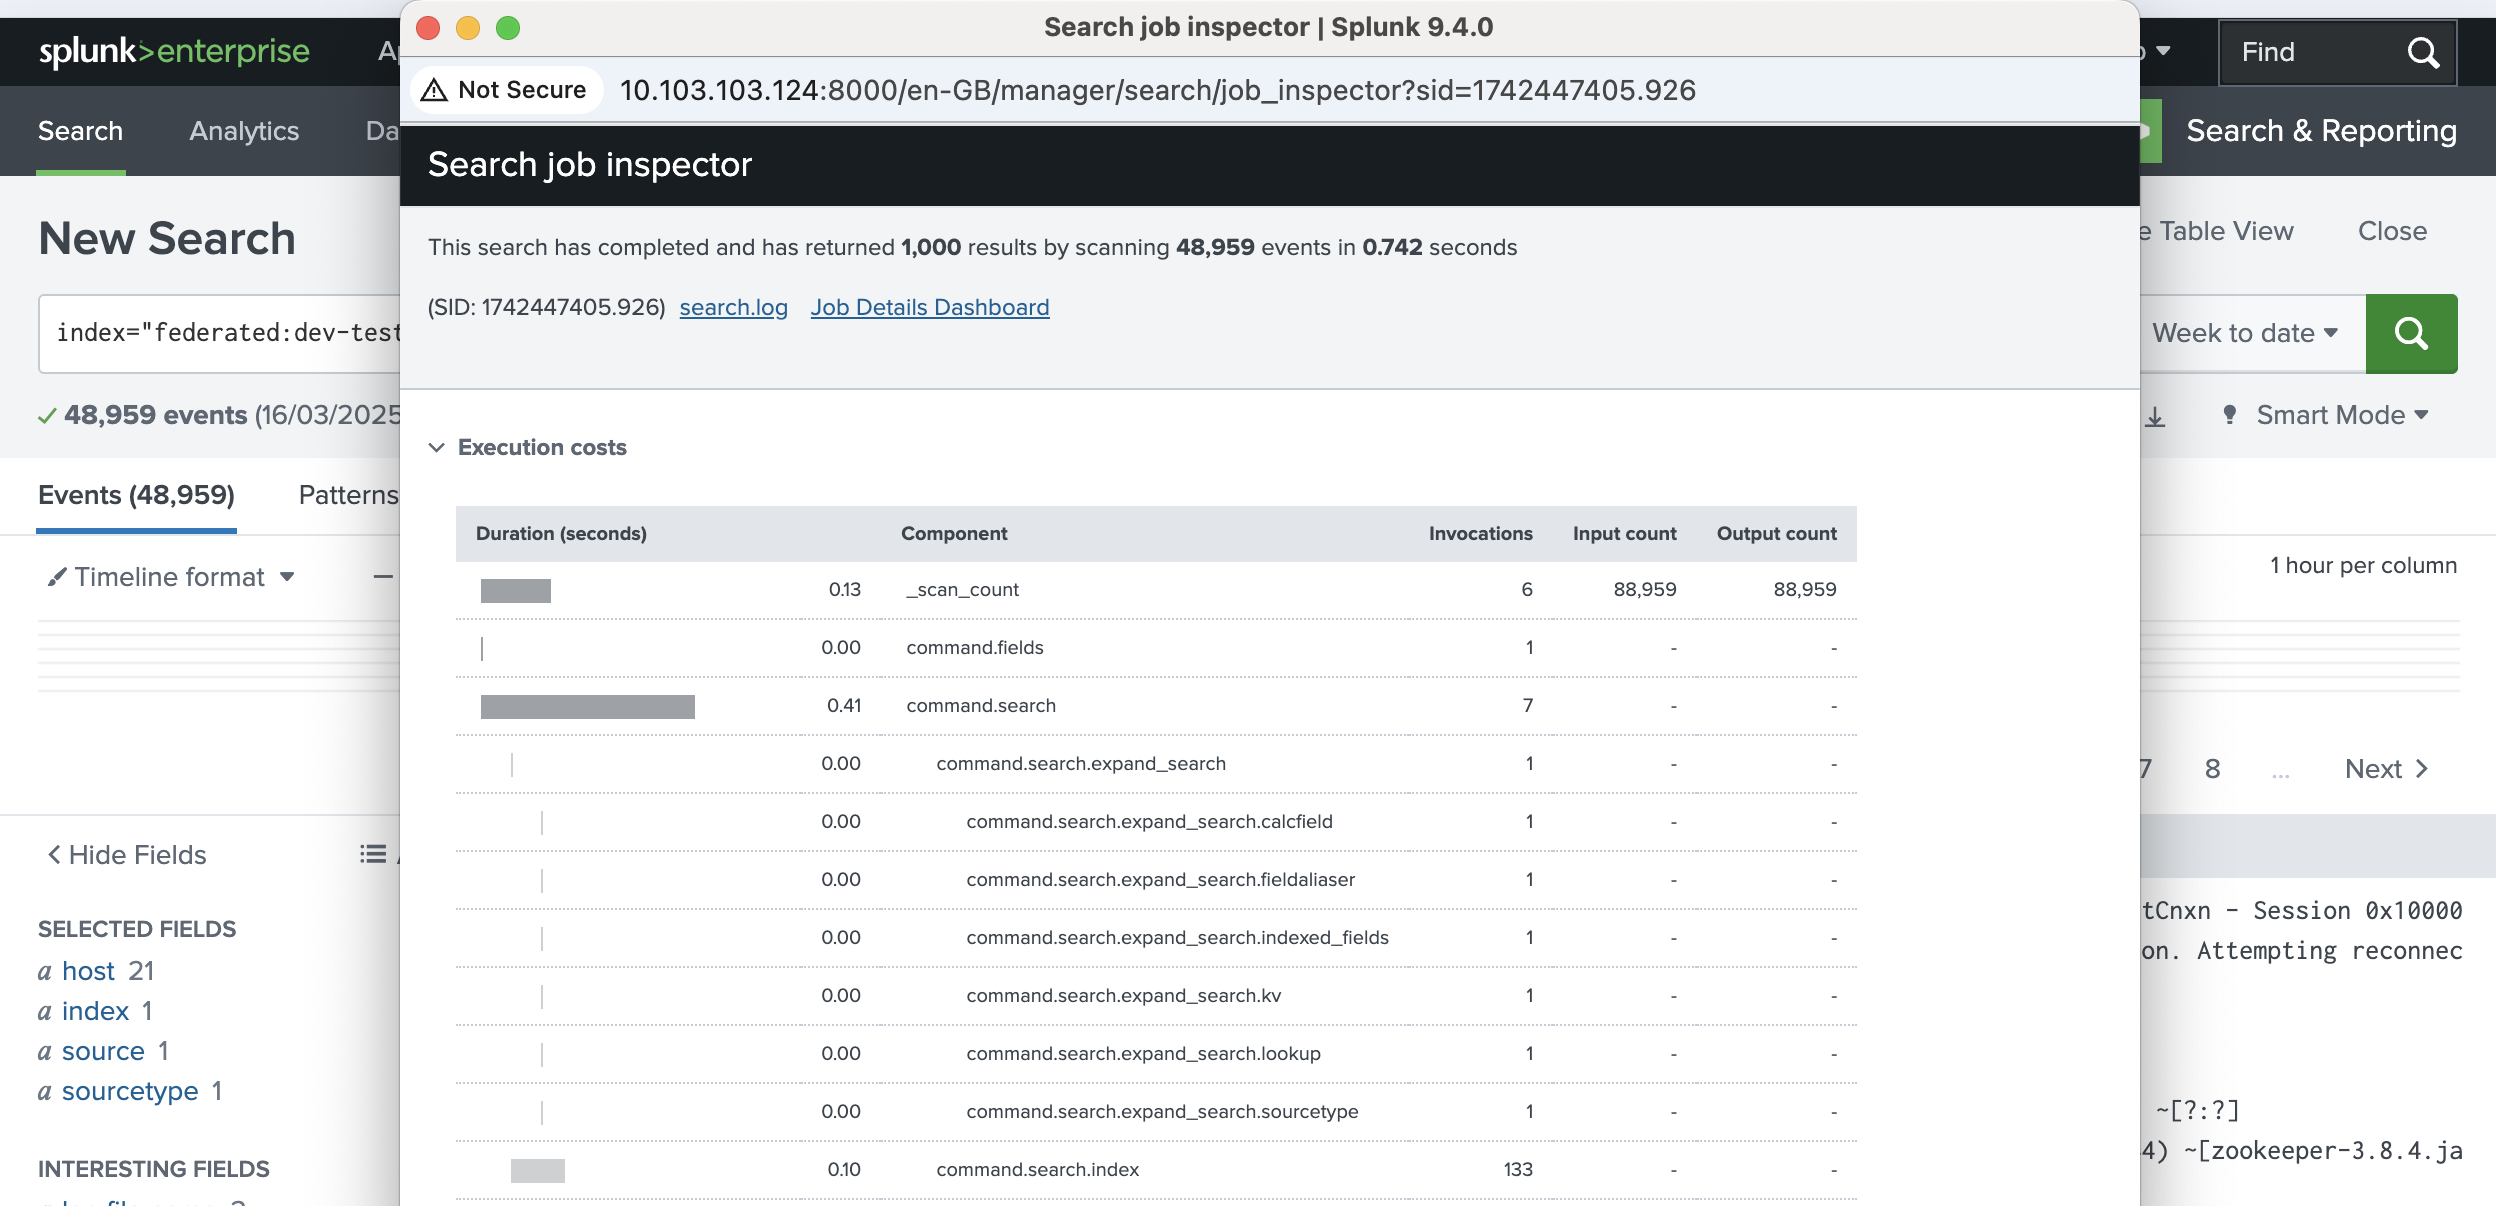
The top section of the job inspector window shows the number of results, the number of events scanned, the duration of the search, and the search ID (SID).
-
The Execution costs section shows the duration of each search component. You can use this information to troubleshoot and improve slow queries. Scroll down to see the components that start with
lumi. See Imply Lumi components for details. -
If you want more information, click Jobs Detail Dashboard in the job inspector dialog to display the properties of the search and examine details of a specific search ID.
-
Close the window when you've finished.
Imply Lumi components
The following components in the job inspector are specific to Imply Lumi:
lumi.bytesProcessed: Number of bytes processed.lumi.endToEnd: Total time to complete the query and send query results from Imply Lumi to Splunk.lumi.intermediate.deserialize: Used internally by Imply.lumi.resultGen: Used internally by Imply.lumi.timeToFirstResult: Time taken to produce the first batch of results.lumi.writeToWire: Used internally by Imply.
Learn more
See the following topics and third-party documents for more information:
- Set up federated search for details on configuring federated search of Imply Lumi events within Splunk.
- Search Imply Lumi events with Splunk for federated search examples using supported SPL commands.
- Splunk documentation on search job properties.
- Splunk Job inspector tips and tricks blog post.